Java troubleshooting: out of memory errors

Running out of memory is one of the most common issues affecting Java (and other JVM language) applications in production. This article explains how to recognise low memory issues, and uses a small program to demonstrate some of the tools you can use to find what's using all your memory.
Overview

Memory issues are an unfortunate part of the Java landscape. If you're running programs on the Java Virtual Machine (JVM) and haven't seen an error like the one shown above, count yourself lucky. For everyone else, these sort of issues are all-too-common—often dealt with by increasing heap sizes, or trying random permutations of JVM switches until they go away.
We tend to see these sort of issues with the JVM because it runs in a fixed-size heap, set when the JVM first starts. As the person running an application, it's up to you to estimate the peak amount of memory your application will require, then to size the JVM heap accordingly. This is tough to get right and often requires some level of experimentation.
Complicating this, low memory issues are not always obvious. If
you're lucky, your application crashes outright when it runs out of
memory. But just as often it continues limping along, with the
garbage collector constantly trying to free some space. This often
causes memory issues to be misdiagnosed as application performance
issues: top reports high CPU usage from the application's JVM, but
it's actually the garbage collector thread doing all the work.
This article focuses on two topics: how to know when you're running out of memory, and how to track down the spot in your application that's using it all.
Identifying low memory
If you're lucky, you know your application is running out of memory because it has told you. If you see this in your log files:
Exception in thread "main" java.lang.OutOfMemoryError: Java heap space
Then you're running out of memory. A popular option at this point is to try increasing your JVM heap size with a JVM switch like:
-Xmx1g
and then hope your problem goes away. This might actually be the right thing to do! If your application's working set peaks at around 1GB for normal usage, then there's no problem here: set your JVM options and take the rest of the day off.
For those still here, we need to do some more digging. An
excellent starting point is to run your application with the
-verbose:gc JVM switch. This tells the garbage collector to log
diagnostic information after each garbage collection run. Once you
enable this, you'll see lines like the following in your console (or
log file):
 [GC 52082K->44062K(116544K), 0.0040520 secs]
 [GC 58654K->45190K(116544K), 0.0042610 secs]
 [GC 59782K->47526K(116544K), 0.0015520 secs]
 [GC 71590K->52294K(116544K), 0.0010260 secs]
 [GC 66886K->93618K(116544K), 0.0074450 secs]
 [Full GC 93618K->42708K(116544K), 0.0126130 secs]
 [GC 56599K->49312K(116544K), 0.0040300 secs]
 [GC 63904K->50976K(116544K), 0.0069590 secs]
 [GC 65568K->53248K(116544K), 0.0014260 secs]
 [GC 77056K->57888K(116544K), 0.0019720 secs]
 [Full GC 99310K->47201K(116544K), 0.0139520 secs]
 [GC 61793K->54476K(116544K), 0.0044440 secs]
 [GC 69068K->56180K(116544K), 0.0054920 secs]
 [GC 70772K->58452K(116544K), 0.0019430 secs]
 [GC 82260K->63060K(116544K), 0.0008430 secs]
 [Full GC 99119K->50845K(116544K), 0.0137490 secs]
 [GC 65437K->58441K(116544K), 0.0050000 secs]
 [GC 73033K->60161K(116544K), 0.0054100 secs]
Each line records the details of a garbage collection run. The lines
marked with GC represent garbage collections of the JVM's young
generation, while lines with Full GC represent garbage collections
of the JVM's old generation.
We won't describe the complete workings of the JVM's memory management here, so here's the short version: the young generation and old generation are different areas of memory where objects are stored, and the JVM garbage collects each area using a different method. The young generation garbage collector is optimised for lots of objects that live fast and die young; the old generation garbage collector is optimised for long-lived objects that are more likely to stick around than not. Objects are allocated from the young generation when first created and, if they live long enough, eventually wind up in the old generation where they live out their days listening to the radio and complaining about the young generation. Good.
So we tend to see more GC lines than Full GC lines, but they're
both telling us the same stuff. Picking one line at random:
[GC 52082K->44062K(116544K), 0.0040520 secs]
This tells us that during this garbage collection run against the young generation:
The heap started out with 52,082KB in use.
Once the garbage collection run had finished, it had reduced the heap down to 44,062KB (freeing about 8MB).
The total committed size of the JVM heap is 116,544KB.
It took about 4 milliseconds to complete the garbage collection run.
What low memory problems look like
When an application is in trouble, you'll start to see a relatively
high number of Full GC messages. That's a sign that objects are
sticking around and filling up the old generation area:
 [GC 85682K->73458K(104448K), 0.0010870 secs]
 [GC 88050K->75730K(116160K), 0.0017100 secs]
 [Full GC 100370K->80306K(116160K), 0.0110770 secs]
 [Full GC 95730K->81808K(116160K), 0.0256440 secs]
 [Full GC 97232K->76495K(116160K), 0.0116220 secs]
 [Full GC 90013K->77613K(116160K), 0.0114290 secs]
 [Full GC 93037K->82221K(116160K), 0.0060700 secs]
 [Full GC 91372K->82222K(116160K), 0.0081970 secs]
 [Full GC 97646K->84525K(116160K), 0.0097500 secs]
 [Full GC 98993K->87661K(116160K), 0.0202760 secs]
People often misinterpret garbage collection logs by focusing on the number on the left of the arrow (the heap utilisation pre-collection). Keep in mind that the normal mode of operation for the JVM is to accumulate garbage until some threshold is reached, then to run the garbage collector to clear it.
If we take some garbage collection logs and plot, over time, the numbers on either side of the arrows (showing heap utilisation before and after garbage collection), a healthy application looks like this:
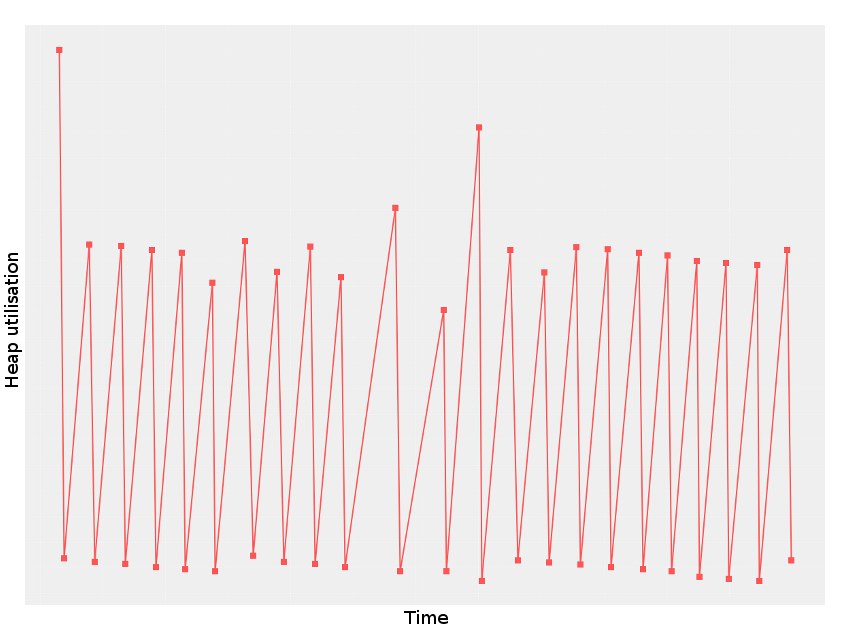
Here we see a sawtooth pattern, where the points at the top represent heap utilisation prior to garbage collection, and the points at the bottom represent heap utilisation immediately after. It's the points at the bottom that matter here: we see that the garbage collector is successfully freeing memory and reverting heap utilisation back to a fairly consistent baseline.
If we plot the garbage collection log lines shown above, things aren't so rosy:
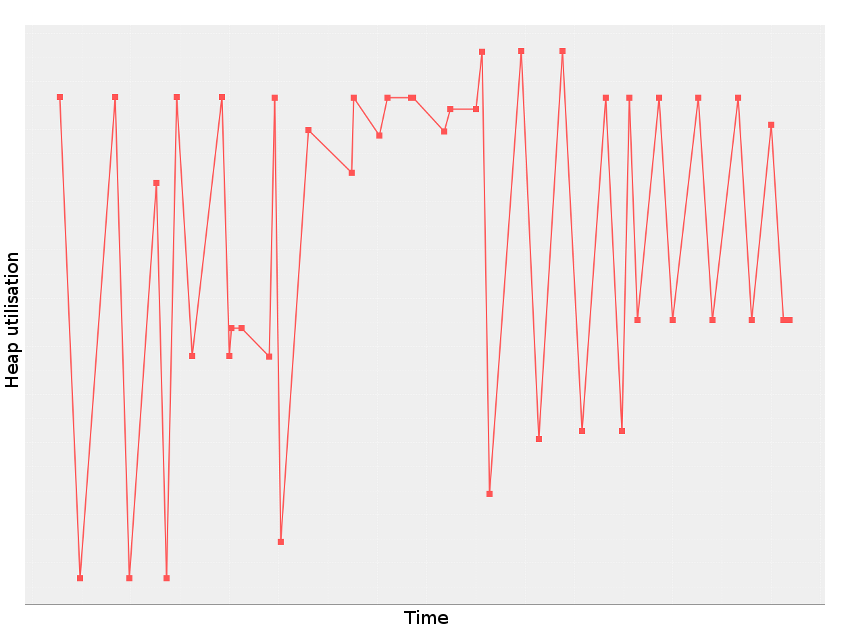
This application seems to be consuming more memory over time. There's a lot of variability in how much memory the garbage collector frees during each run, and a long-term trend of freeing less memory with each collection.
To summarise, you might have low memory problems if:
You're seeing frequent
Full GCmessages in your logs; andThe post-garbage-collection utilisation number is growing over time.
If that's the case, it's time to start tracking down your memory leak.
Finding memory leaks
In this section we'll look at some of the tools you can use for finding memory leaks in your code. In the spirit of contrived examples, here's a contrived example! This example has two parts:
GibberishGeneratorgenerates very long lines of gibberish words of varying lengths.MemoryLeakexamines these lines of gibberish to find the first "good" word matching some criteria and keeps the list of good words it finds in a list.
Here's the code:
 import java.util.ArrayList;
 import java.util.List;
 import java.util.Iterator;
 import java.util.Random;


 public class MemoryLeak
 {
     // Generates long lines of gibberish words.
     static class GibberishGenerator implements Iterator<String>
     {
         private int MAX_WORD_LENGTH = 20;
         private int WORDS_PER_LINE = 250000;
         private String alphabet = ("abcdefghijklmnopqrstuvwxyz" +
                                    "ABCDEFGHIJKLMNOPQRSTUVWXYZ");

         public boolean hasNext() {
             return true;
         }

         public String next() {
             StringBuffer result = new StringBuffer();
             for (int i = 0; i < WORDS_PER_LINE; i++) {
                 if (i > 0) { result.append(" "); }
                 result.append(generateWord(MAX_WORD_LENGTH));
             }

             return result.toString();
         }

         public void remove() {
             // not implemented
         }


         private String generateWord(int maxLength) {
             int length = (int)(Math.random() * (maxLength - 1)) + 1;
             StringBuffer result = new StringBuffer(length);
             Random r = new Random();

             for (int i = 0; i < length; i++) {
                 result.append(alphabet.charAt(r.nextInt(alphabet.length())));
             }

             return result.toString();
         }
     }


     // A "good" word has as many vowels as consonants and is more than two
     // letters long.
     private static String vowels = "aeiouAEIOU";

     private static boolean isGoodWord(String word) {
         int vowelCount = 0;
         int consonantCount = 0;

         for (int i = 0; i < word.length(); i++) {
             if (vowels.indexOf(word.charAt(i)) >= 0) {
                 vowelCount++;
             } else {
                 consonantCount++;
             }
         }

         return (vowelCount > 2 && vowelCount == consonantCount);
     }


     public static void main(String[] args) {
         GibberishGenerator g = new GibberishGenerator();
         List<String> goodWords = new ArrayList<String>();

         for (int i = 0; i < 1000; i++) {
             String line = g.next();
             for (String word : line.split(" ")) {
                 if (isGoodWord(word)) {
                     goodWords.add(word);

                     System.out.println("Found a good word: " + word);
                     break;
                 }
             }
         }
     }
 }
This code has a memory leak (gasp!). Let's give it a run with a modest JVM heap and see what happens:
 $ java -verbose:gc -Xmx64m MemoryLeak
 ...
 Found a good word: EDeGOG
 [Full GC 44032K->32382K(51136K), 0.0088630 secs]
 [GC 39742K->33566K(58368K), 0.0027320 secs]
 [GC 44382K->36990K(58304K), 0.0041990 secs]
 [Full GC 45982K->44686K(58304K), 0.0224270 secs]
 Found a good word: eZjovI
 [Full GC 51071K->38076K(58304K), 0.0059460 secs]
 [GC 45436K->39228K(58304K), 0.0007690 secs]
 [GC 46588K->40412K(53440K), 0.0009190 secs]
 [Full GC 52380K->42684K(53440K), 0.0085100 secs]
 [Full GC 50044K->42684K(53440K), 0.0086750 secs]
 [Full GC 50044K->42313K(53440K), 0.0092640 secs]
 [Full GC 47351K->42313K(53440K), 0.0077370 secs]
 [GC 42313K->42313K(57984K), 0.0008850 secs]
 [Full GC 42313K->42297K(57984K), 0.0151990 secs]
 Exception in thread "main" java.lang.OutOfMemoryError: Java heap space
     at java.util.Arrays.copyOf(Arrays.java:2882)
     at java.lang.AbstractStringBuilder.expandCapacity(AbstractStringBuilder.java:100)
     at java.lang.AbstractStringBuilder.append(AbstractStringBuilder.java:390)
     at java.lang.StringBuffer.append(StringBuffer.java:224)
     at MemoryLeak$GibberishGenerator.next(MemoryLeak.java:24)
     at MemoryLeak.main(MemoryLeak.java:74)
It finds a few words and then runs out of memory. Let's look at some tools for finding out more.
Using jmap
The jmap tool comes as standard with the Java SDK, so there's a good
chance you have it already. Using jmap, you can connect to a
running JVM and walk its memory pools, printing a summary of the
number of instances of each class and how many bytes of heap each is
using.
To start, get the process ID of the JVM you're debugging:
 $ ps -ef | grep MemoryLeak
 mst      14979 14511 99 13:53 pts/29   00:00:03 java -verbose:gc -Xmx64m MemoryLeak
Then read the warning below and instruct jmap to attach to that
JVM and walk its heap:
 $ jmap -F -histo 14979
 Attaching to process ID 14916, please wait...
 Debugger attached successfully.
 Server compiler detected.
 JVM version is 20.12-b01
 Iterating over heap. This may take a while...
 Object Histogram:

 num       #instances    #bytes  Class description
 —————————————————————————————————————
 1:              952     37806240        char[]
 2:              4997    684344  * MethodKlass
 3:              4997    617648  * ConstMethodKlass
 4:              344     381264  * ConstantPoolKlass
 5:              7790    346488  * SymbolKlass
Warning: The target JVM will be suspended while
jmapdoes its thing, so don't do this on an application that people are actually using!
Looking at the top few lines of jmap's output, there is already a
clue: at the moment we took our sample, there were 952 character
arrays occupying some 37MB of our 64MB JVM heap. Seeing big character
arrays at the top of the list is often a good sign that there are some
big strings being stored somewhere. Interesting...
A handy trick for running
jmap(or any command!) at the exact moment your JVM throws an OutOfMemoryError is to use the-XX:OnOutOfMemoryErrorJVM switch. You can invoke it like this:java -Xmx64m -XX:OnOutOfMemoryError='jmap -histo -F %p' MemoryLeakThe JVM's process ID will automatically be substituted for the
%pplaceholder.
Working with heap dumps
Sometimes seeing the jmap histogram is enough to make you realise
where the memory leak is—if the topmost entry is one of your own
classes (like MyBrilliantCacheEntry) then just curse yourself and
move on. But, unfortunately, the largest user of space is very often
either char[] or byte[], so all you have is the not-that-helpful
knowledge that your memory is being used by... data?
At this point, a heap dump can be helpful. A heap dump gives you a
static snapshot of your application's memory and, using tools like
jvisualvm or the Eclipse Memory Analyzer, you can inspect your heap
dump and look at what's in there.
Getting a heap dump using jmap
The jmap tool can connect to a running JVM and produce a heap dump.
Here's how that works:
 $ jmap -F -dump:format=b,file=heap.bin 14979
 Attaching to process ID 16610, please wait...
 Debugger attached successfully.
 Server compiler detected.
 JVM version is 20.12-b01
 Dumping heap to heap.bin ...
 Heap dump file created
This produces a file called heap.bin that can be read by several
analysis tools. We'll see how that works in the following sections.
Getting a heap dump on OutOfMemoryError
If you can run your JVM with special switches, you can ask it to
produce a heap dump whenever an OutOfMemoryError is thrown. Just
run your JVM with:
 java -Xmx64m \
      -XX:+HeapDumpOnOutOfMemoryError \
      -XX:HeapDumpPath=/tmp/heap.bin  \
      MemoryLeak
As before, this will produce a heap dump file called heap.bin
Producing a heap dump from a core file
Usually one of the previous two ways is sufficient to get a heap dump,
but here's a bit of trivia. If you connect to your JVM process with
gdb:
 $ gdb -p 14979
 GNU gdb (GDB) 7.4.1-debian
 ...
 (gdb)
you can use it to dump a standard Unix core file:
 (gdb) gcore
 Saved corefile core.14979
and then use jmap to create a heap dump from the resulting core
file:
 $ jmap -dump:format=b,file=heap.bin `which java` core.14979
 Attaching to core core.14979 from executable /usr/local/bin/java, please wait...
 Debugger attached successfully.
 Server compiler detected.
 JVM version is 20.12-b01
 Dumping heap to heap.bin ...
 Finding object size using Printezis bits and skipping over...
 Heap dump file created
This also works under Solaris for core files produced with the gcore
command.
Exploring heap dumps
Whichever method you chose, you should now have a file called
heap.bin containing a snapshot of your application's memory from
around the time it was having problems.
There are several tools that you can use to analyse heap dumps. If
you're feeling old-school, there's jhat, which comes with the Java
SDK. Run it against your dump file like this:
 $ jhat heap.bin
 Reading from heap.bin...
 Dump file created Tue Oct 29 14:19:49 EST 2013
 Snapshot read, resolving...
 Resolving 29974 objects...
 Chasing references, expect 5 dots.....
 Eliminating duplicate references.....
 Snapshot resolved.
 Started HTTP server on port 7000
 Server is ready.
and then browse to http://localhost:7000/ to explore the heap dump.
For a long time, jhat was my go-to for this sort of thing. But
these days, the interface provided by jvisualvm is my weapon of
choice. The Java SDK ships with jvisualvm as standard, so you
should be able to start it up by running jvisualvm (or just
visualvm on some systems). You should see something like:
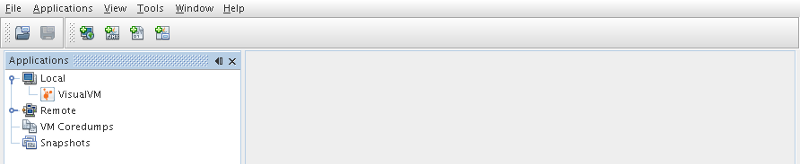
We'll load our application's heap dump:
- Click the
Filemenu - Click
Load - Select "Heap Dumps" for "Files Of Type"
- Navigate to your
heap.binfile
You'll see your heap dump open in the main jvisualvm pane:
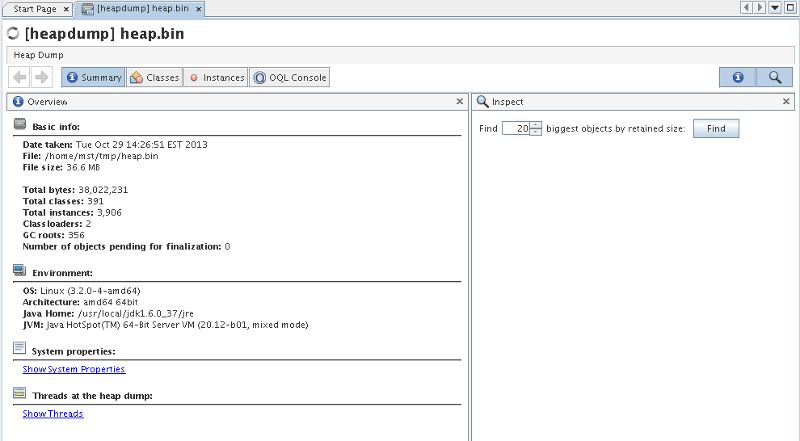
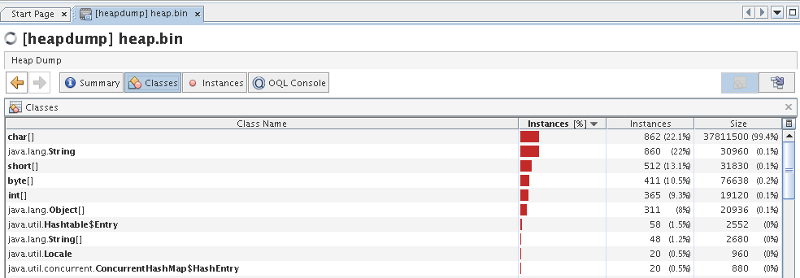
Clicking the Classes tab, we see pretty much what jmap showed us
before: lots of char[] instances using all of our memory.
From this screen, we can drill down and look at the instances
themselves. Double click on the entry for char[] and you'll be
transferred to the Instances tab.
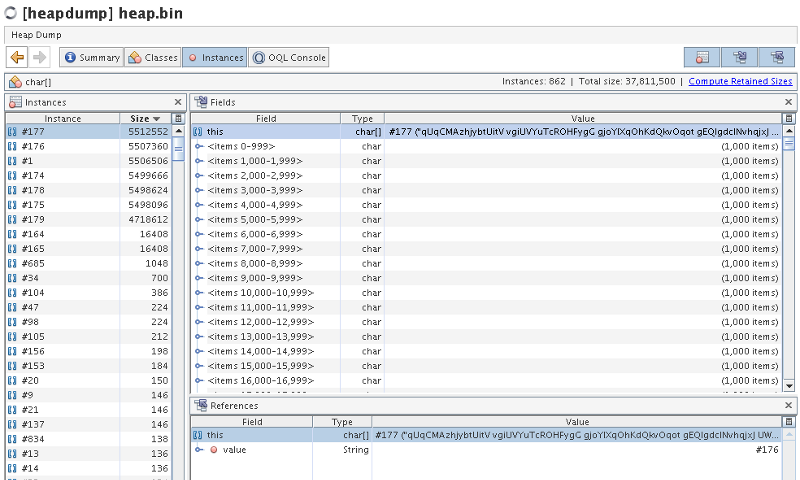
At the top of the list on the left, we see several instances, each about 5MB. That's a lot of character data! Looking at the pane on the right gives the game away:
qUqCMAzhjybtUitV vgiUVYuTcROHFygG gjoYlXqOhKdQkvOqot gEQlgdcINvhqjxJ ...
Welsh?! No... gibberish.
An epiphany!
What jvisualvm is showing us is seven large strings, each around
5MB, and each containing lots of gibberish words. That's the clue we
needed: something in our program is holding the input lines of
gibberish in memory, stopping the garbage collector from freeing them.
Now that you know the cause, you might like to return to the original code and see if you can spot the problem. Spoiler below...
Spoiler
Here's the culprit:
             String line = g.next();
             for (String word : line.split(" ")) {
                 if (isGoodWord(word)) {
                     goodWords.add(word);
We take each (5MB) line of gibberish, split it into words, check each word, and keep the first one we find. What's wrong with that?
It's actually a curiosity of Java: strings are immutable, so there's no harm if two strings share the same character array behind the scenes. In fact, Java uses this to good effect to make taking substrings very fast. If we have two strings like:
 String s1 = "hello world";
 String s2 = "hello world".substring(0, 5);
Then s2 can be created without the need for an additional character
array at all: it just stores a reference to the character array of
s1, along with the appropriate offset and length information to
capture the fact that it's a "slice" of the original string.
In the case of our code, split creates a substring of the original
5MB input line, but that substring contains a reference to the
character array from the original input line. Even after the original
string is long gone and garbage collected, its character array lives
on in the substring! It's sort of beautiful, really.
We can fix it by explicitly cloning the substring:
             String line = g.next();
             for (String word : line.split(" ")) {
                 if (isGoodWord(word)) {
                     goodWords.add(new String(word));
and now our program runs without blowing up, and this concludes our emotional journey.
Update: As of Java 1.7 update 6, string behaviour has changed so that taking a substring doesn't hold on to the original byte array. That's a bit of a blow to my contrived example, but the overall approach to finding the issue still holds.
Update 2: Since around 2017 I've used YourKit for this sort of stuff. It's a great general-purpose profiler and its tools for memory analysis are hard to beat. It costs money (like you) and if you do this sort of thing often it's well worth it.
Links
Some of the tools mentioned in this article:
Need a hand? Find me at mark@teaspoon-consulting.com.